for data management & business analytics
InnEx Academy for data management & business analytics
We are the subsidiary company of Innovation Excellence International Group (InnEx) which is a leading international consulting company in Europe (head office in Germany- Berlin).
We provide advisory management services to government, private sector, SMEs, and individuals to improve their competitive advantage and performance levels, and to support them in achieving their professional goals.
- Data Management
- Data Analytics
- Business Analytics
Our Services
Our Consulting services allow companies from all sectors to implement Strategies and Solutions to achieve business alignment, and drive max value from the current initiatives.
Our expert Data Management Consultants & Business Analysis Specialists work with clients to help them solve organizational problems. Our analysts evaluate a company’s database systems to help them meet their business objectives. Their primary duties include analyzing and diagnosing a company’s infrastructure, understanding a client’s business needs, and designing and implementing a technology solution.
Data Management
We believe “Data Management” is a process that includes acquiring, validating, storing, protecting, and processing required data to ensure the accessibility, reliability, and timeliness of the data for its users.
The benefits of data management include enhanced compliance, greater security, improved sales and marketing strategies, better product classification, and improved data governance to reduce organizational risk.
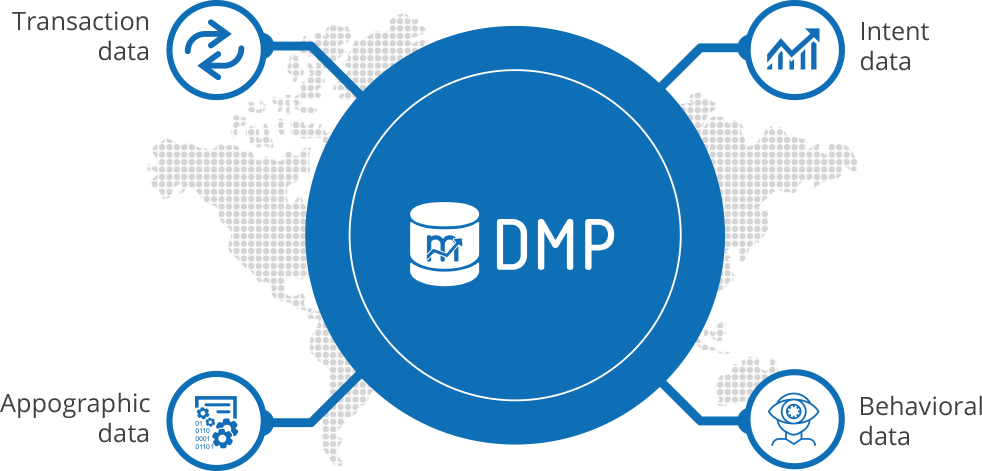
A data management platform (DMP) is a software platform used for collecting and managing data. This allows the businesses to identify audience segments, which can be used to target specific users and contexts in online advertising campaigns. Our DMPs use big data and artificial intelligence algorithms to process and analyze large data sets about users from various sources.
Hierarchical Databases
Our hierarchical database is a design that uses a one-to-many relationship for data elements. Hierarchical database models use a tree structure that links a number of disparate elements to one “owner,” or “parent,” primary record.
Network Databases
Our network database model allows multiple records to be linked to the same owner file. The model can be seen as an upside down tree where the branches are the member information linked to the owner, which is the bottom of the tree. The multiple linkages which this information allows the network database model to be very flexible. In addition, the relationship that the information has in the network database model is defined as many-to-many relationship because one owner file can be linked to many member files and vice versa.
Relational Databases
A Relational database is a type of database that stores and provides access to data points that are related to one another. Relational databases are based on the relational model, an intuitive, straightforward way of representing data in tables. In a relational database, each row in the table is a record with a unique ID called the key. The columns of the table hold attributes of the data, and each record usually has a value for each attribute, making it easy to establish the relationships among data points.
Object-Oriented Databases
Our Object-oriented databases (OODB) are databases that represent data in the form of objects and classes. An object is a real-world entity, and a class is a collection of objects. Object-oriented databases follow the fundamental principles of object-oriented programming (OOP). The combination of relational model features (concurrency, transaction, and recovery) with object-oriented principles results in an object-oriented database model.
Graph Databases
Our Graph databases are purpose-built for storing and analyzing relationships among the data, as the data entities as well as the relationships among them are pre-connected and do not require time-consuming table joins or multiple scans across a large table.
ER Model Databases
Our Entity Relationship Model (ER Modeling) is a graphical approach to database design. It is a high-level data model that defines data elements and their relationship for a specified software system. An ER model is used to represent real-world objects.
Document Databases
We believe document-oriented database, or document store, is a computer program and data storage system designed for storing, retrieving and managing document-oriented information, also known as semi-structured data.
NoSQL Databases
Our NoSQL, which stands for “not only SQL,” is an approach to database design that provides flexible schemas for the storage and retrieval of data beyond the traditional table structures found in relational databases
Data Collection
Our DMP essentially collects all your data from any touch point you have with your customer.
Data include all the online and offline sources like:
Digital touch point
Digital touchpoints refer to engagements with your brand online, which include your website, ads, search engine results, social media, and more.
Web Data Analytics
Web analytics is the collection, reporting, and analysis of website data. The focus is on identifying measures based on your organizational and user goals and using the website data to determine the success or failure of those goals and to drive strategy and improve the user’s experience.
Mobile App
Mobile App Data track unique users to record their statistics real-time. This takes place when the app triggers data at the action of a user while visiting a web page. This data is then recorded in the mobile analytics platform which is then used to derive insights.
Marketing Campaigns
Data-driven marketing campaigns use customer data to optimize performance, by enabling more accurate predictions about customer behavior. By offering enhanced insights into your audience, we can use this data for more precise targeting, personalized customer experiences and improved return on investment (ROI)
Behavioral & Demographic data
Characteristics such as a customer’s age, gender, location, income, and occupation frequently correlate to behavioral data.
Demographic data refers to socioeconomic information expressed statistically including employment, education, income, marriage rates, birth and death rates, and more.
Social Media
Social media data is the collected information from social networks that show how users share, view or engage with your content or profiles. These numbers, percentages and statistics provide actionable insights concerning your social media strategy.
Store Information
Data storage refers to the use of recording media to retain data using computers or other devices. The most prevalent forms of data storage are file storage, block storage, and object storage, with each being ideal for different purposes.
Call Center Inquires
Call Center Data allows for an unparalleled opportunity to monitor and improve a variety of service metrics from call times, efficiency, employee performance and customer satisfaction.
DMP
At our organization DMP works by:
- Collecting Data from various sources
- Create Audiences
- Push Audiences to buying/Execution Platforms
- Optimize Results
- Collect Response Data
Data Analysis
At our organization, we believe, Data analysis is a process of cleaning, transforming, and modeling data to discover useful information for business decision-making. The purpose of Data Analysis is to extract useful information from data and taking the decision based upon the data analysis.
- Find New Trends
- Uncover Vast Opportunities
- Predict Future Actions, Triggers & Events
- Make Prompt Decisions
Descriptive Analysis
Descriptive Analysis is the type of analysis of data that helps describe, show or summarize data points in a constructive way such that patterns might emerge that fulfill every condition of the data. It is one of the most important steps for conducting statistical data analysis.
Diagnostic Analysis
The diagnostic analysis is a special type of analytical technique using which the data is interpreted and analyzed properly to find out what happened or caused a particular cyber breach. There are various different techniques that are used for the sake of understanding or extracting data for it to be analyzed properly.
Predictive Analysis
Predictive Analysis is the use of statistics and modeling techniques to determine future performance based on current and historical data. Predictive analytics looks at patterns in data to determine if those patterns are likely to emerge again, which allows businesses and investors to adjust where they use their resources to take advantage of possible future events.
Prescriptive Analysis
Prescriptive Analysis is the Mix all the insights gained from the other data analysis types, and you have prescriptive analysis. Sometimes, an issue can’t be solved solely with one analysis type, and instead requires multiple insights.
Out pathway to establish complete Data Analysis include:
Understanding the Business Requirements
Understanding the business or activity that your data project is part of is key to ensuring its success and the first phase of any sound data analytics project.
Collection of Data
Data collection starts with primary sources, also known as internal sources. This is typically structured data gathered from CRM software, ERP systems, marketing automation tools, and others. These sources contain information about customers, finances, gaps in sales, and more. Then comes secondary sources, also known as external sources. This is both structured and unstructured data that can be gathered from many places.
Categorization of the Data
Data categorization is the sorting of data according to its type, sensitivity, and value to the organization if altered, stolen, or destroyed. It helps an organization understand the value of its data, determine whether the data is at risk, and implement controls to mitigate risks.
Enrichment of the Data
Enriching data is by joining datasets — essentially, retrieving columns from one dataset or tab into a reference dataset. This is a key element of any analysis, but it can quickly become a nightmare when you have an abundance of sources. manipulate it in order to get the most value out of it.
Data Interpretation
Data interpretation is the process of reviewing data through some predefined processes which will help assign some meaning to the data and arrive at a relevant conclusion. It involves taking the result of data analysis, making inferences on the relations studied, and using them to conclude.
Data Visualization
Data visualization gives us a clear idea of what the information means by giving it visual context through maps or graphs. This makes the data more natural for the human mind to comprehend and therefore makes it easier to identify trends, patterns, and outliers within large data sets.
Our tools to Analyze Data are:
- Business Intelligence Tools.
- Statistical Analysis Tools
- General purpose programming languages
- SQL Consoles
- Spreadsheet Applications
- Data Modelling Tools
- Industry Specific Analytics Tools
- Unified Data Analytics Tools
- ETL Tools
- Predictive Analytics Tools
- Data Science Platforms
- Data Visualization Tools
Business Analysis
We affirm Business analytics (BA) is the combination of skills, technologies, and practices used to examine an organization's data and performance as a way to gain insights and make data-driven decisions in the future using statistical analysis.
Out pathway to establish complete Data Analysis include:
Our enhanced Business Analytics help the organizations to:
Have Significant Customer Service
To ensure businesses can retain their customer base, they turn to analytics. For example, companies can analyze a customers interaction on their website and past purchasing habits. Based on this data, they can analyze patterns and make improvements to their website performance.
Have More Accurate Decision Making
Businesses often outsource a few of their processes to enhance their efficiency. When it comes to selecting vendors for such activities, they need to know which one will bring more profits. Analytics can help them evaluate supplier performance based on customer ratings, order fulfilment speed, quality, etc. This data will help them decide which one works best for their business.
Minimal Employee Turnover
Every year, companies have to bear an extensive cost due to employee onboarding and attrition. To save time and costs, HR professionals can use analytics tools to examine the likelihood of an employee aligning with a company’s culture, tracking their performance and how satisfied they are with the new role, and similar factors. Once you know such answers, it will be easier to recognize employees who will stick to your company for a long time.
Amplify Operational Efficiency
Efficiency is not always limited to employees. Businesses can also analyze other resources to learn more about their performance. For example, a grocery store chain was able to reduce refrigeration costs by merely analyzing the temperatures of in-store coolers.
Identify Duplicity
Finance companies have begun using analytics to reduce fraud. One way they do this is by using data to identify potentially fraudulent purchases, based on the analysis of customer’s previous transactions. This helps rate the risk that a particular customer presents and use this analysis to prevent losses, and builds stronger customer relationships.
Have Greater Revenue
Companies that embrace data and analytics initiatives can experience significant financial returns. The collection and analysis of data, no matter how it takes shape, can help businesses achieve their goals specifically growing revenue
Our Process of Business Analytics include:
Discovering the Business Need
The first stage in the business analytics process involves understanding what the business would like to improve on or the problem it wants solved. Sometimes, the goal is broken down into smaller goals. Relevant data needed to solve these business goals are decided upon by the business stakeholders, business users with the domain knowledge and the business analyst.
Gathering the Data
This stage involves cleaning the data, making computations for missing data, removing outliers, and transforming combinations of variables to form new variables. Time series graphs are plotted as they are able to indicate any patterns or outliers. Once the data has been cleaned, the analyst will try to make better sense of the data. The analyst will plot the data using scatter plots (to identify possible correlation or non-linearity).
Analyzing the Data
At this stage, using statistical analysis methods such as correlation analysis and hypothesis testing, the analyst will find all factors that are related to the target variable. The analyst will also perform simple regression analysis to see whether simple predictions can be made.
Forecast the Consequences
Business analytics is about being proactive in decision making. At this stage, the analyst will model the data using predictive techniques that include decision trees, neural networks and logistic regression. These techniques will uncover insights and patterns that highlight relationships and ‘hidden evidences’ of the most influential variables.
Find an Ideal Solution
At this stage the analyst will apply the predictive model coefficients and outcomes to run ‘what-if’ scenarios, using targets set by managers to determine the best solution, with the given constraints and limitations. The analyst will select the optimal solution and model based on the lowest error, management targets and his intuitive recognition of the model coefficients that are most aligned to the organization’s strategic goal.
Fabricate a proper Resolution
The analyst will then make decisions and take action based on the derived insights from the model and the organizational goals. An appropriate period of time after this action has been taken, the outcome of the action is then measured.
We believe in using the below as best tools for BA
Analytical Software
Statistical Tools
Predictive Modelling

Data Mining Tools
Benchmarking
Our “Benchmarking” is the practice of comparing business processes and performance metrics to industry bests and best practices from other companies. Dimensions typically measured are quality, time and cost. Benchmarking can also help organizations identify areas, systems, or processes for improvements—either incremental (continuous) improvements or dramatic (business process re-engineering) improvements. Our ‘Benchmarking Process’ provides necessary insights to help you understand how your organization compares with similar organizations, even if they are in a different business or have a different group of customers.
- Focuses on best practices to identify next practices
- Strives for continuous improvement.
- Helps in Partnering to share information.
- Is Needed to maintain a competitive edge.
- Adapting based on customer needs after examination of the best
Classification
Benchmarking can be internal (comparing performance between different groups or teams within an organization) or external (comparing performance with companies in a specific industry or across industries).
We believe Benchmarking, whether internal or external, is used in three key ways as mentioned below:
This is all about better understanding your processes, comparing performance against internal and external benchmarks, and finding ways to optimize and improve your processes. The idea is that, by understanding how top performers complete a process, you can find ways to make your own processes more efficient, faster and more effective.
This compares strategies, business approaches and business models in order to strengthen your own strategic planning and determine your strategic priorities. The idea is to understand what strategies underpin successful companies (or teams or business units) and then compare these strategies with your own to identify ways you can be more competitive.
This involves collecting information on how well you’re doing in terms of outcomes (which could mean anything from revenue growth to customer satisfaction) and comparing these outcomes internally or externally. This can also refer to functional performance benchmarking, such as benchmarking the performance of the HR team (using metrics like employee net promoter score or staff engagement surveys) or the marketing team (measuring net promoter score or brand awareness, for instance).
Internal Benchmarking
The internal benchmarking refers to the comparison of the organizational performance internally. Either with its previous performances or with that of its competitors, i.e., the companies belonging to the same industry. Here, the information is usually gathered and circulated within the organization itself.
Following are the various strategies falling under this category apart from ‘Performance Benchmarking’:
- SWOT: In this benchmarking strategy, the strengths, weaknesses, opportunities and threats of the company are listed out and analyzed by the management.
- Best Practice Benchmarking: The management themselves studies and identifies the strategies and practices of the other companies who are the market leaders, to plan the desired course of action.
- Financial Benchmarking: The management conducts a comparative study of the financial forecast with the actual results or financial reports to find out the areas of shortcomings and take corrective actions.
- Functional Benchmarking: The company compares its performance and products with that of other related industries to innovatively improve its functionality.
External Benchmarking
In external benchmarking, the companies compare their performance with that of its competitors in the industry or across the globe. Usually, by the data collected through associations or third party.
Following are different external strategies apart from ‘Process and Strategic’ Benchmarking:
- Collaborative Benchmarking: To improve the performance standards, the companies belonging to a particular industry collaborate with the industrial associations. These associations provide the benchmarking data on best practices and a comparative analysis of all the companies, to facilitate the improvement of the underperforming companies.
- Product Benchmarking: This strategy focuses on the in-depth analysis of the competitor’s product to know its features and composition. The company uses this strategy to improve and redesign its products.
- Corporate Benchmarking: The company compares its various departments like finance, production, distribution, marketing, human resource, etc. with those of its competitors to enhance the efficiency of each division.
- Global Benchmarking: It is similar to strategic benchmarking, the only difference is that here the company compares its strategies with those of its other branch or the various competitors spread across the globe, to take corrective actions.
Process of Benchmarking
Planning:
- Define a tightly focused subject of the benchmarking study. Choose an issue critical to the organization’s success.
- Form a cross-functional team. During Step 1 and 2, management’s goals and support for the study must be firmly established.
- Study your own process. Know how the work is done and measurements of the output.Identify partner organizations that may have best practices.
Collect
- Collect information directly from partner organizations. Collect both process descriptions and numeric data, using questionnaires, telephone interviews, and/or site visits.
Analyze
- Compare the collected data, both numeric and descriptive.
- Determine gaps between your performance measurements and those of your partners.
- Determine the differences in practices that cause the gaps.
Adapt & Implement
- Develop goals for your organization’s process.
- Develop action plans to achieve those goals.
- Implement and monitor plans.
Monitoring
- As with most projects, in order to reap the maximum benefits of the benchmarking process, a systematic evaluation should be carried out on a regular basis.
- Assimilating the required information, evaluating the progress made, re-iterating the impact of the changes and making any necessary adjustments, are all part of the monitoring process.
Our Components of Benchmarking
For Our Benchmarking, to be effective and to lead to successful performance has to reflect the following elements:
Benchmarking is about external focus and it is essential that all exercises seek to enhance the delivery of quality levels to the end customer.
Benchmarking is a strategic competitive tool and as such it seeks to achieve standards of performance in the market place and to raise the internal standards of effectiveness, making them more competitive.
Benchmarking makes organizations seek to establish standards way beyond meeting basic requirements and to work towards a continuous surge for new ideas, new methods and new ways of working.
Benchmarking gives organizations the impetus and the desire to follow those organizations which are top of the league and which pioneer new change and new innovations.
Benchmarking helps organizations focus on weaknesses and strengthen them. It also enables them to protect areas of strength and ensure that they sustain high levels of competitiveness.
Benchmarking is a practice which encourages individuals to learn continuously and to ensure that their knowledge, skills and areas of expertise are never obsolete.
Benchmarking, if introduced in a direct fashion, will always ensure that organizations are not lagging behind and they are always pioneering the latest practices that the market demands.
Benchmarking reminds people to focus continuously and constantly on the end customer and on market demands, and as such, it changes the culture from internal focus to an external one.
Benchmarking encourages people to work smarter rather than harder, through constantly asking questions related to the practices, their jobs and tasks and to ask why the outputs are lower or higher than those of competitors and other organizations